Brand self-service Reporting
Role: Sole Product Designer
Task : Conceptualize and design a reporting dashboard that has robust analytics for campaign sales and social performance (realtime data + historical rS data + AI/ML) to maximize campaign ROAS, ROI, revenue and reach.
Campaign Reporting
Access metrics for paid influencer posts by clicking on the Reports tab and navigating to Campaign Reporting
The default view displays all posts. View individual campaigns results by selecting the campaign name from the drop down.
To view performance by channel, toggle between LTK and Instagram from the Channel drop down.
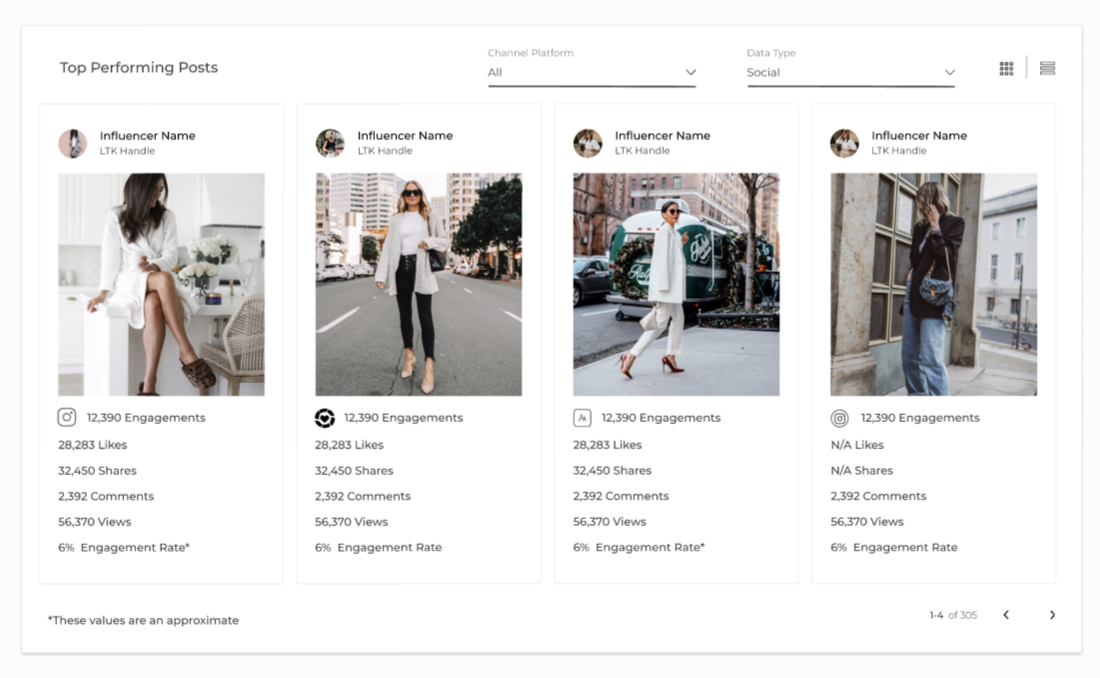
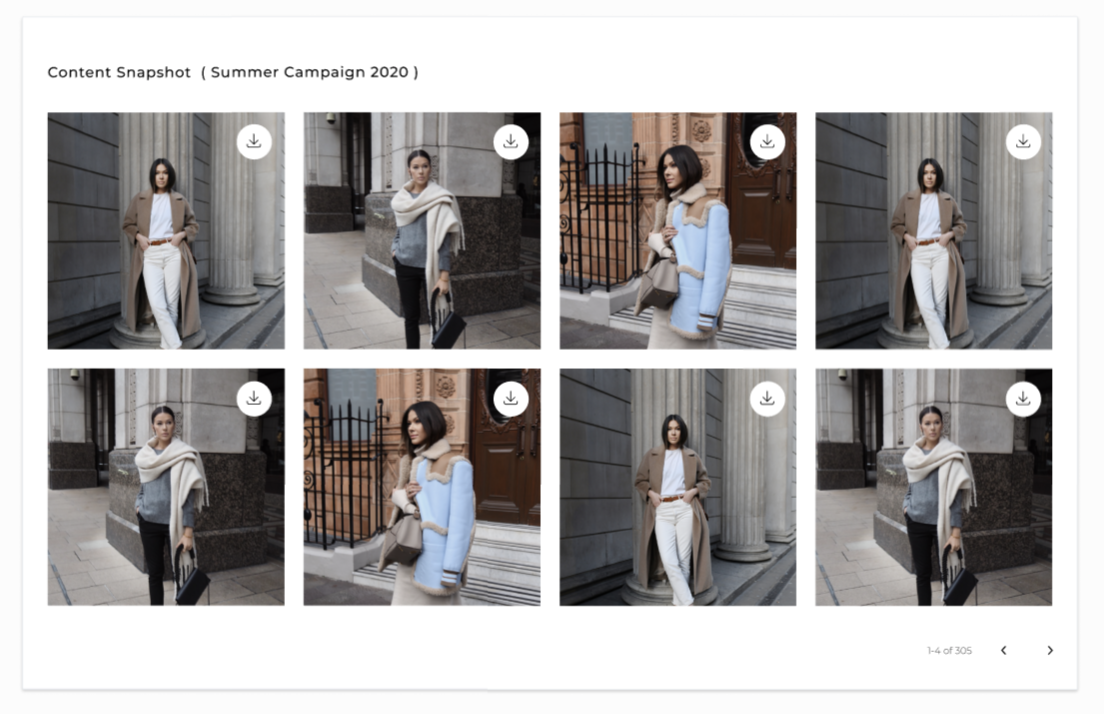
Custom widgets include:
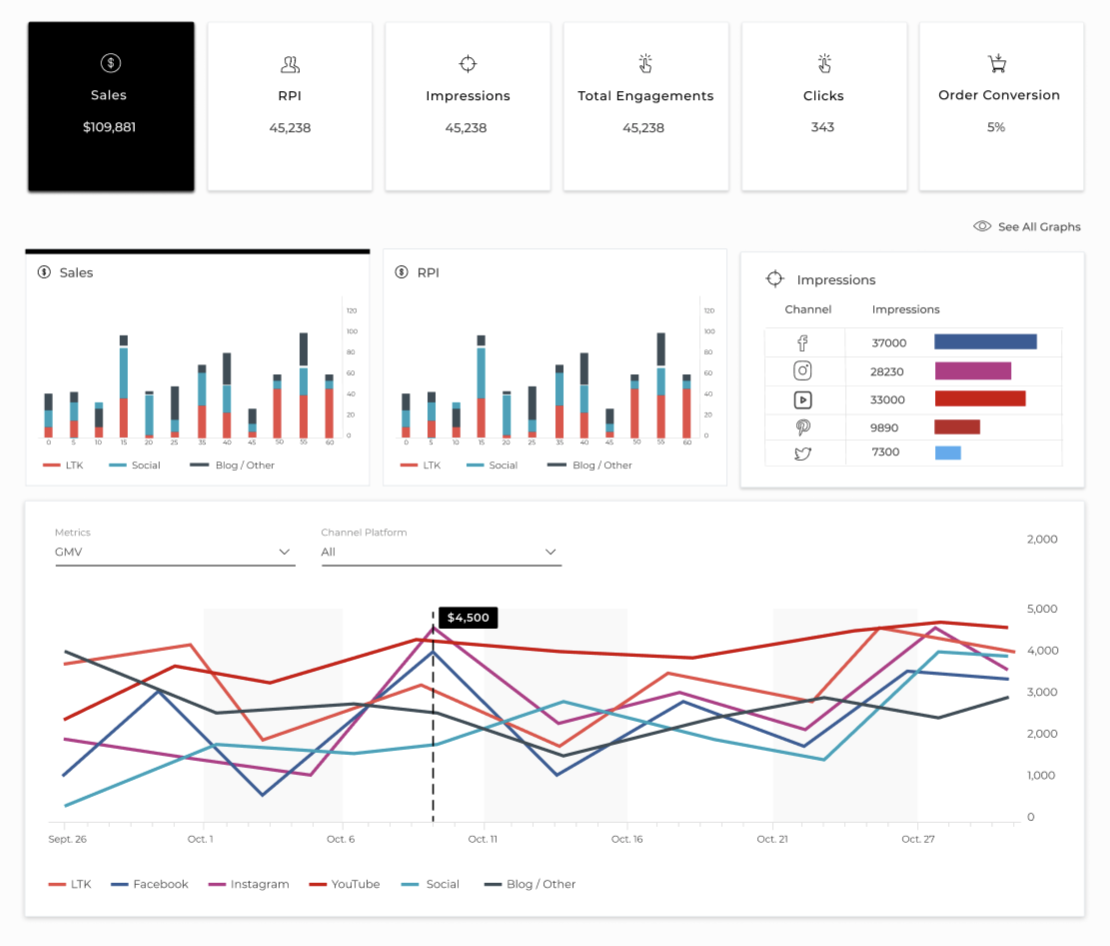
High level metric cards
Hero Chart with aggregate metrics
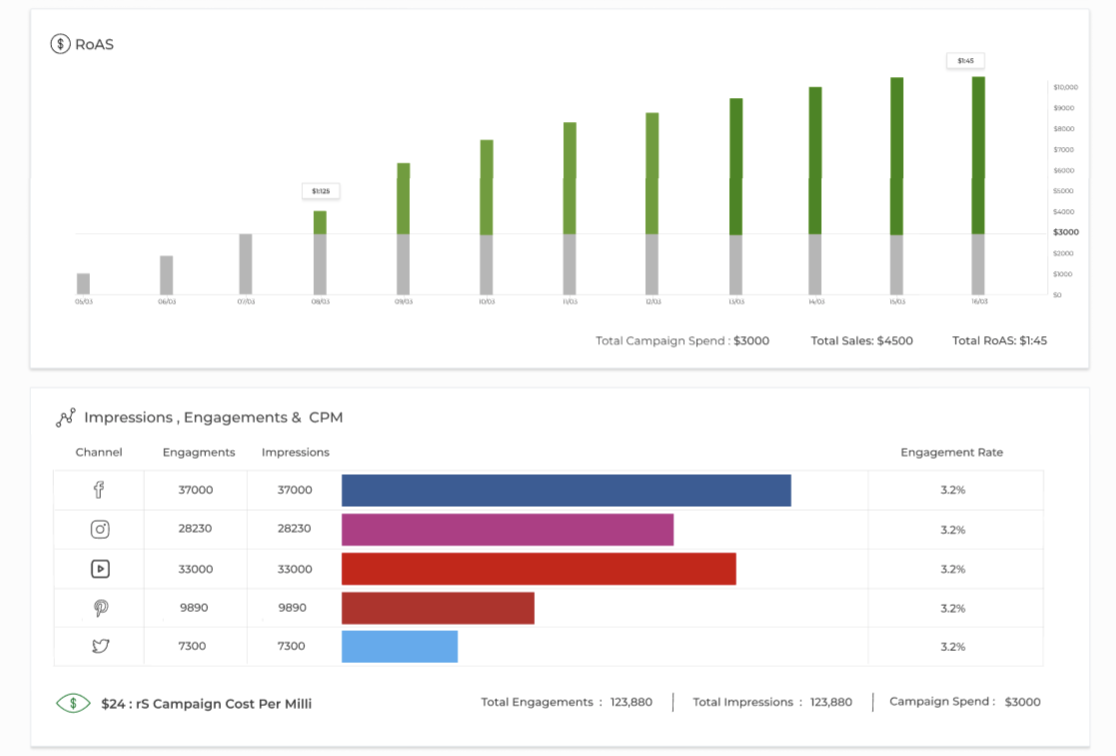
ROAS
Impressions, Engagements & CPM
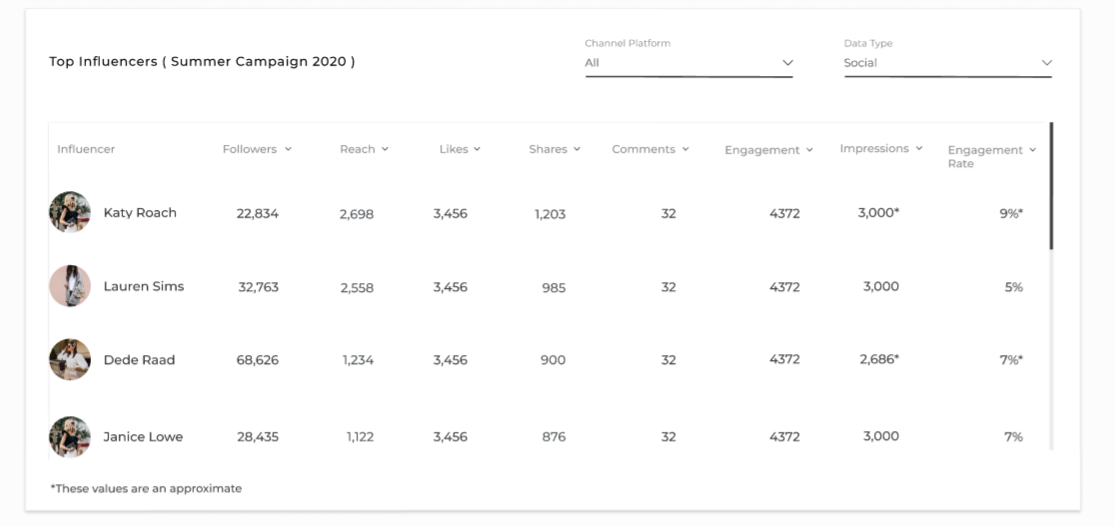
Top influencers
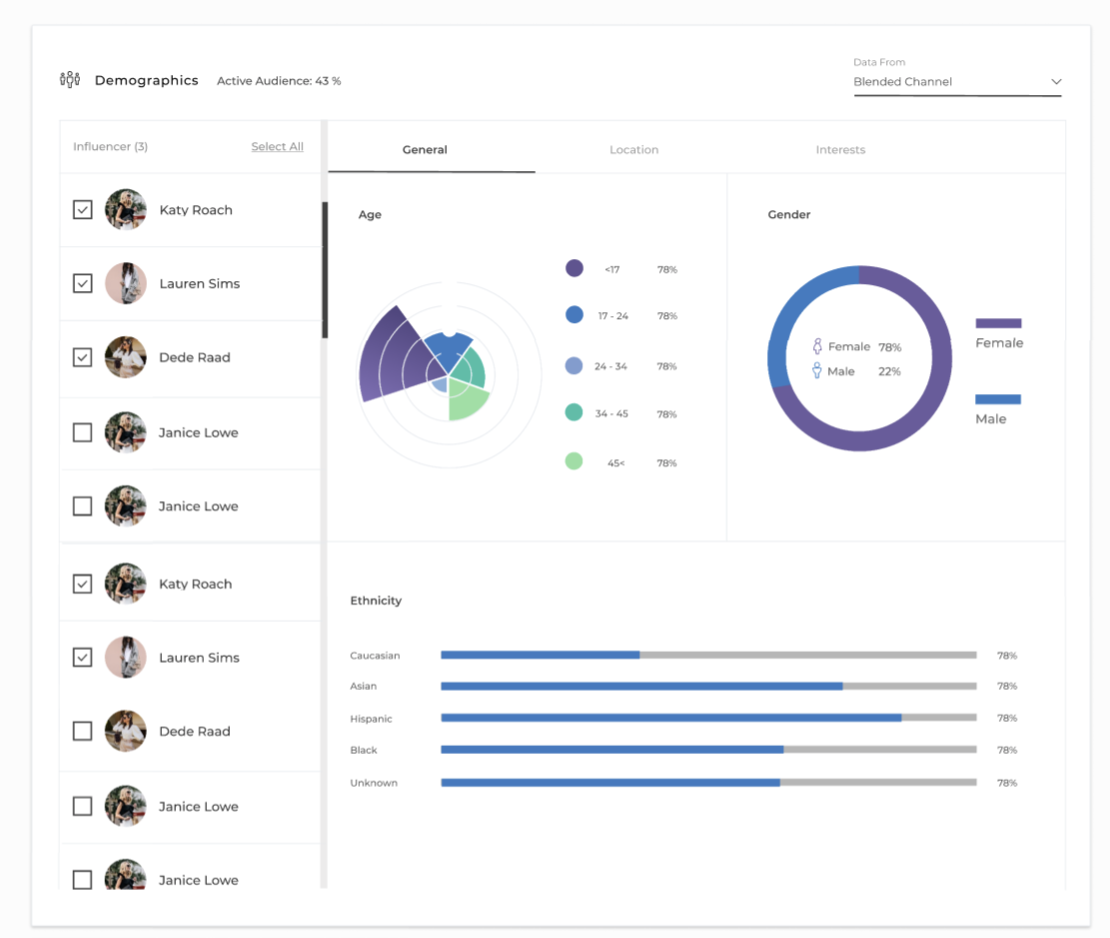
Demographic Widget
Top Posts
Top Products
Device Insights
Content Snapshot
MVP Key features:
Dynamic Date Selection
Sales & Clicks Data
GMV,RPI, %LTK,CR%, Clicks, Orders, AOV, RPI,
Program Segmentation
Widgets : RPI,, Single Metric Charts, Hero Charts, & Metric Over time.
Nightly Data Sync
Accessible through reporting nav
25 month data window
Automatic Period Aggregation
